Learn more about
Products
Best Practice Solutions for the Municipal Security Lifecycle
About MuniCLIMATE Scores
Climate Risk Scores for Local Governments, School Districts & Municipal Utilities
MuniCLIMATE Scores measure climate impact across 18 event types including coastal flooding, hurricanes, earthquakes, wildfires, drought, and strong wind. Part of our MuniCLIMATE Solutions product suite, these Scores are available as an add-on component to MuniCREDIT Online or as a separate data feed.
Carbon Transition Risk and Physical scores for over 90% of U.S. Local Governments and School Districts are available as MuniCLIMATE Scores. All scores were developed by Spatial Risk Systems (SRS), whose methodology is based on unifying and standardizing a vast number of data sources — primarily from US agencies — providing the ability to measure and quantify facility risk.
Transition Risk Scores
Scores for Transition Risk use Scope 1 and Scope 2 emissions estimates to determine the Carbon Transition Liability, factoring in a social cost of carbon of $42 per metric ton. These scores provide “common sense” context by comparing the Carbon Transition Liability with real world financial and demographic metrics, such as population, total revenues, assessed valuation, net capital assets, and median household income. Figure 1 illustrates how these scores appear in DPC’s MuniCREDIT Online (MCO) platform.

Figure 1. Carbon transition risks ratios are expressed as both a numerical value and as relative state and national scores.
Physical Risk Scores: Environmental Risk and Climate Impact
The Environment Risk Score measures risk from exposure to harmful environmental factors. These include exposure to lead paint, various air quality indicators, and issuers’ proximity to toxic sites. Figure 2 illustrates how these scores are shown in MCO.
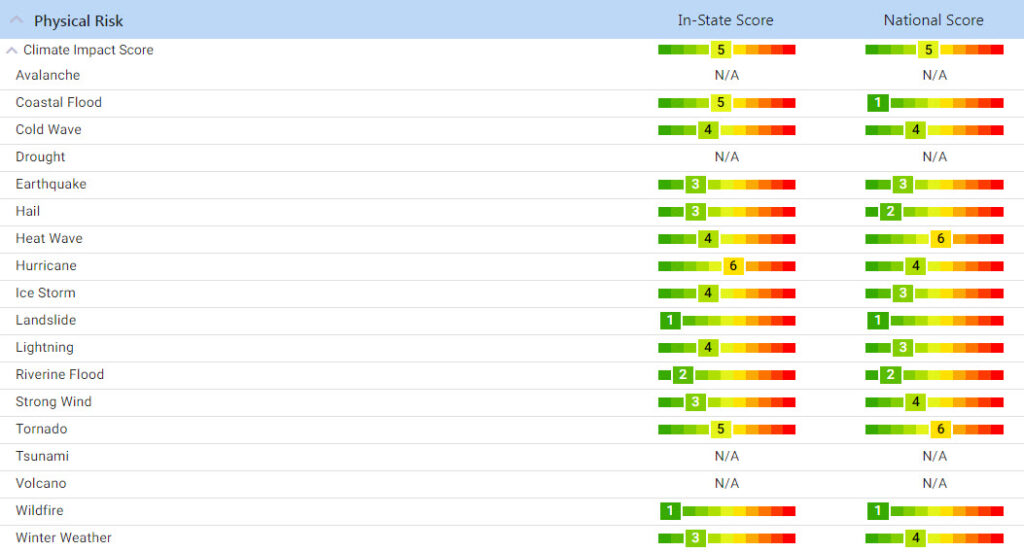
Climate Impact Scores (Figure 2) represent the overall risk of monetary damage from 18 possible types of natural disasters. They factor in asset exposure, historic loss ratio, and hazard frequency when determining risk magnitude.

Figure 2. All scores are shown on a relative basis with other similar governmental units in the same state and across the entire country. (Scoring: 1 = Extremely favorable to 10 = Extremely vulnerable)
Community Vulnerability Scores (Figure 2) represent the relative level of susceptibility of the community to natural disasters, environmental hazards, and other adverse events. These scores take age, gender, wealth, poverty, race, special needs, and service sector employment into account.
Community Resilience Scores (Figure 2) represent the relative level of a community’s ability to prepare, mitigate, recover and adapt to a major disaster. These scores take into account quality of life, economic and financial outlook, building and housing infrastructure, governance, as well as community capital.
Have questions about MuniCLIMATE Solutions?
We’ve put together the most commonly asked questions about this product offering. Check out MuniCLIMATE Solution FAQs.
Learn more
To talk to us about MuniCLIMATE Solutions or request a free sample report, contact your DPC DATA representative or email sales@dpcdata.com.
Sign up and get the latest news and insights about DPC DATA’s municipal bond credit, disclosure, and compliance data solutions delivered right to your inbox.


