Resources
[RESEARCH] Municipal Disclosure Timeliness Is Improving, But Selectively
The issue of municipal disclosure continues to be at the forefront of market discussions. A new study from DPC DATA shows the timeliness of municipal financial disclosure filings has in fact been improving, albeit to varying degrees depending on the sector.
Annual Financial Disclosure Obligations
The issue of municipal disclosure continues to be at the forefront of market discussions. Earlier this year, at a Fixed Income Market Structure Advisory committee meeting, SEC Chair Jay Clayton again expressed his concern about the current state of municipal disclosure practices and related legal issues. That said, a new study from DPC DATA shows that the timeliness of municipal financial disclosure filings has in fact been improving, albeit to varying degrees depending on the sector.
DPC DATA has analyzed financial disclosures from different municipal bond sectors as well as states from the period of 2012 to 2018. The total population for this study consists of 250,649 filed audited and unaudited annual financial statements (AFS) and comprehensive financial reports (CAFR), with 33,000 unique obligors. The study does not rely on the raw submissions on the EMMA site, which may contain filing errors, but on filing date data that DPC DATA has checked and validated.
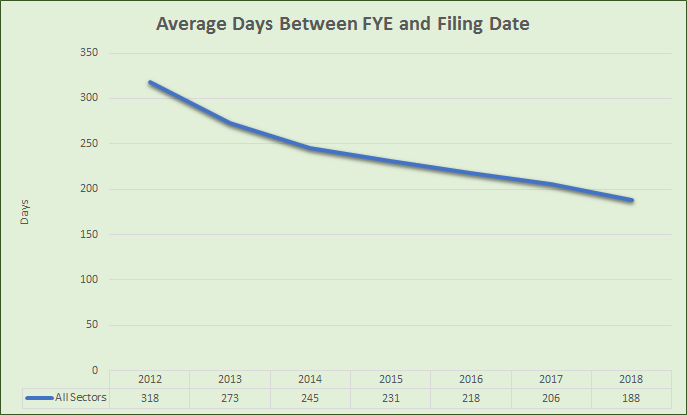
Figure 1. EMMA® Average Submission Days between FYE
Looking at the combined sectors of municipal bonds (Figure 1), it took obligors 131 days less in 2018 than it took in 2012 to file their financial statements. Hovering at 318 days back in 2012, filing timeliness has subsequently improved to 188 days in 2018.
Compliance of Muni Bond Sectors to Their Continuing Disclosure Undertakings
DPC DATA has further analyzed around 250,000 continuing disclosure undertakings (CDUs) of all obligors from 2012 to 2018. Excluded were those without a written specified deadline to find out the most frequently used filing deadline an obligor usually undertakes in its CDU. After calculating the mode of filing deadlines per sector, the most recurring mode was 180 days after the fiscal year-end (FYE). Interestingly, only two sectors – Miscellaneous Education and Solid Waste – deviated from the norm, most frequently using 270 days after FYE as filing deadline. These figures found were then subjected as CDU benchmarks with their financial reports submission per sector.
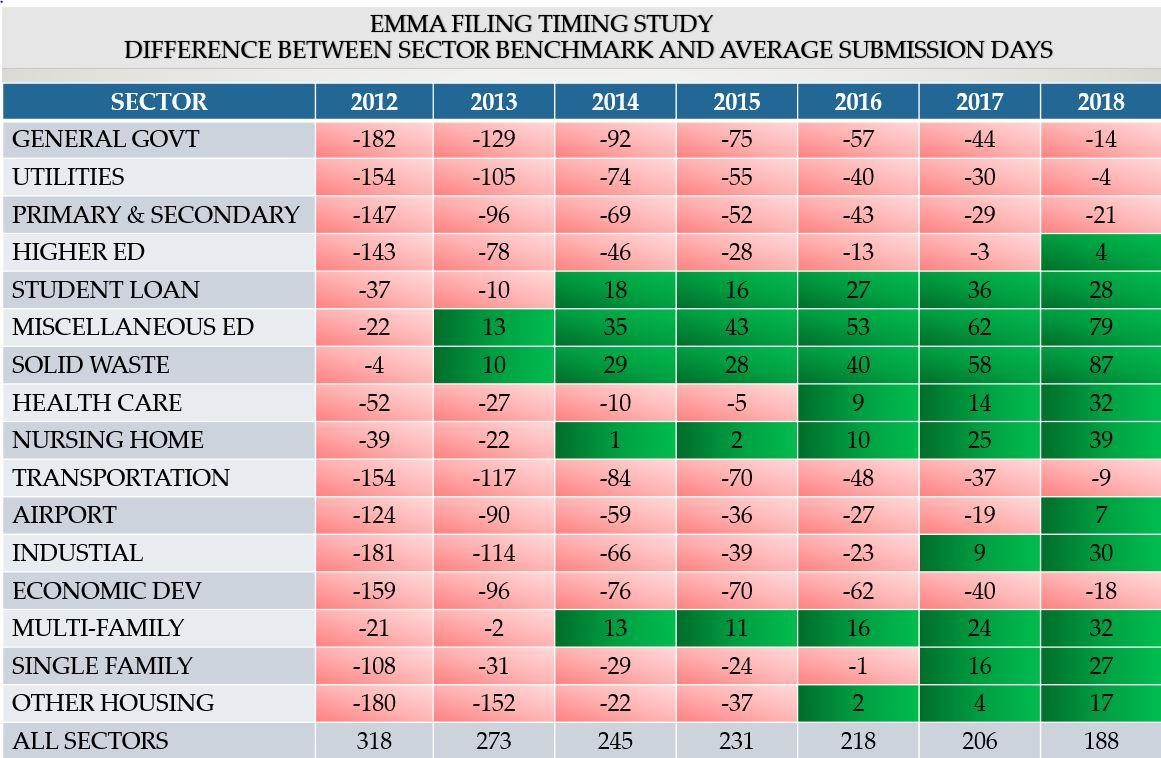
Figure 2. Sector Benchmark vs. Average Submission Days
Notes for Figure 2:
- Sector days shaded in Green show sector compliance with its CDU benchmark.
- Those days shaded in Red show sector non-compliance with its CDU benchmark.
- Sector days was calculated by subtracting the CDU benchmark to the average submission days of the sector per year. For example: for 2012’s General Government sector, its CDU benchmark is 180 days, minus the average days it took the sector to submit to EMMA® which was 362 days; hence the result is -182 days, a non-compliance. The same process was done for all sectors, except for Misc. Education and Solid Waste sectors, as mentioned, their CDU benchmark is 270 days.
- EMMA® is the official public disclosure repository of municipal bond issuers and underwriters. It is owned by the MSRB. As shown in the chart above, the municipal sectors that have shown the greatest improvement in terms of timeliness of disclosure are those related to either structured financings (e.g., student loans or housing) or tax-exempt enterprises which are run like corporations (e.g., health care).
Sectors Showing Improvements in Disclosure Timeliness
Acknowledging that the Miscellaneous Education and Solid Waste sectors most frequently use 270 days after FYE as filing deadline, both sectors have been compliant to their CDUs in general since 2013. The most timely sectors- Student Loan, Multi-Family Housing, and Nursing Home – achieved the 180-day filing deadline by 2014. Other sectors have followed since and by 2018, 11 out of the 16 sectors are in the green.
The MCDC Initiative implemented in 2014 was intended to address violations by municipal issuers and underwriters regarding representations in their continuing disclosure obligations. It encourages underwriters, issuers, and obligated persons alike to self-report to the SEC or face penalties and sanctions. Furthermore, if the issuer or obligor chose not to self-report, it would face more significant penalties.
Since 2014, more and more sectors have been meeting the sector general deadlines: Two sectors in 2013, five sectors in 2014 and 2015, seven in 2016, nine in 2017, and 11 sectors by 2018. None of the sectors has experienced a backslide since.
Unfortunately, the primary laggards are core municipal sectors such as the General Government, Primary and Secondary Education, Transportation, Utilities, and Economic Development sectors, which comprise approximately 80% of the entire filing population. The said lagging sectors did manage to shave off 146 average late days from their sector benchmark from -159 days to -13 days, an overall 92% improvement.
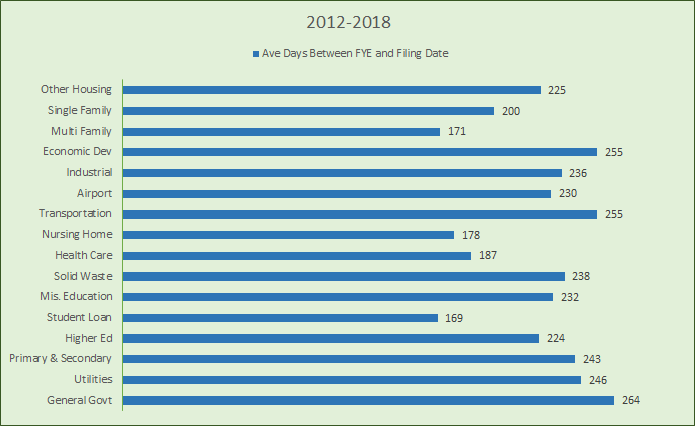
Figure 3. Per Sector Average Days Between FYE and Filing Date 2012-2018
With regards to the fastest sector during the covered period (Figure 3), the Student Loan sector was the fastest (169 days), followed by Multi-Family Housing (171 days), and Nursing Home (178 days).
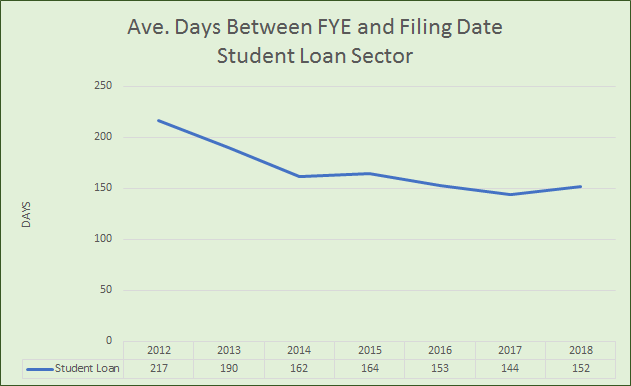
Figure 4. Average Days Between FYE and Filing Date – Student Loan Sector
Timeliness of Disclosure for Student Loans and Multi-Family Housing
On a per sector basis, the Student Loan sector (Figure 4) managed to shave off 65 days from its average days of filing financial statements, from 217 days in 2012 to 152 by 2018. Timing is improving, but it hasn’t been consistent, hitting bumps in 2015 and 2018 where the average days rose compared to the prior year. The sector shows an average yearly improvement of 11 days less per year.
Between 2012 and 2018, the best reporting entities (based on average) under this sector were Texas Higher Education Coordinating Board at 85 days, South Carolina Student Loan Corporation at 100 days as well as State Education Assistance Authority (NC) at 105 days.
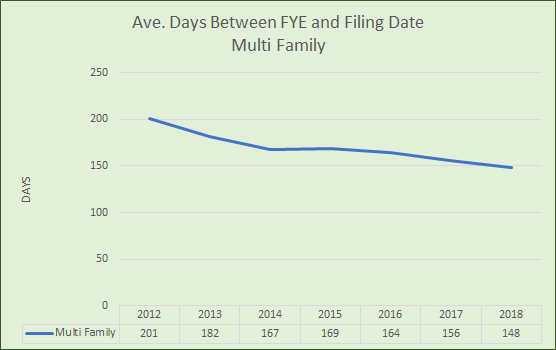
Figure 5. Average Days Between FYE and Filing Date – Multi-Family Sector
The Multi-Family Housing sector (Figure 5) comes in at second. Starting with taking 201 average days to file in 2012, it ended with 148 days by 2018. In other words, a 26% improvement of 56 fewer days in 6 years. The improvement isn’t consistent as well for this sector, with a 2-day bump to 169 days in 2015 from 167 in 2014. Some notable reporting multi-family home borrowers include, for instance: 1. Samuel Kelsey Redevelopment LP (DC) (averaging 74 days), 2. Casa De Encanto Senior Apartments LIHTC, LP (AZ) (averaging 75 days), and 3. Guadalupe Huerta Senior Apartments LIHTC, LP (AZ) (averaging 81 days).
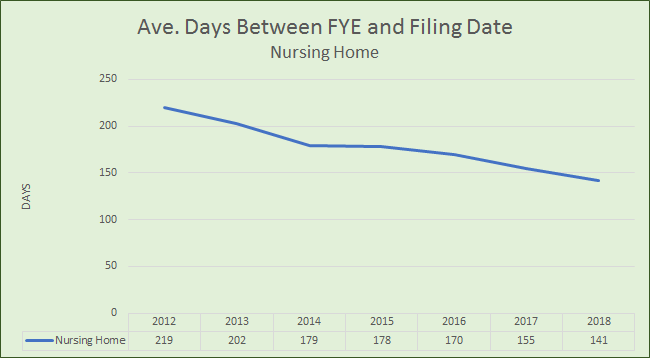
Figure 6. Average Days Between FYE and Filing Date – Nursing Home Sector
Nursing Home Sector Gains
The Nursing Home sector came in 3rd, with an average of 178 days between 2012 to 2018. It started in 2012 with an average of 219 days and had reduced that time to 141 days by 2018. The sector shows a yearly average improvement of 13 days. Based on the average and consistency, the best reporting entities under this sector are Saint Mary’s Home of Erie (PA) at 76 days, Wichita Falls Retirement Foundation DBA Rolling Meadows (TX) at 90 days, and Carpenter’s Home Estates, Inc. (FL) at 98 days.
The timeliest sectors – Student Loan, Multi-Family Housing, and Nursing Home– all met the standard of 180 days. Their average days solely for the year 2018 send a hopeful outlook of filing compliance in the municipal bond sector: 152 days for Student Loan, 148 days for Multi-Family Housing, and 141 days for the Nursing Home sector.
Worst Performing Sector
The worst performing sector of the 2012-2018 period was the General Government sector. It started with 362 days in 2012 and ended with 194 days by 2018. The sector managed to shave off 169 days within the 6 years but hasn’t met the general 180-day finish line.
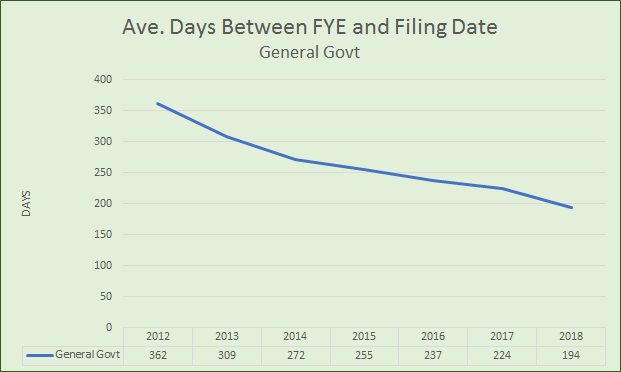
Figure 7. Average Days Between FYE and Filing Date – General Government Sector
The General Government sector being the least on time is no surprise because it has been trailing behind the rest of the industry since 2012. Unavailable financial reports can cause a delay in submission submitted way past their filing deadlines that was needed for compliance completion purposes especially during the MCDC purge. Back as early as 2013, the SEC filed a case against the City of Harrisburg, Pennsylvania, for omitting material information about their financial struggles through merely conducting public statements about their financial condition and not producing and filing any past financial reports as required by their CDUs. Another was post-MCDC in 2017 when the SEC found out Beaumont Financing Authority, another governmental instrumentality created by the City of Beaumont, California, have multiple undisclosed late filings.
Conclusion
Since the financial crisis, regulators and market participants have worked together to encourage issuers, through their advisors and bankers, to conform to new filing regulations and disclosure amendments. As regulators push for greater transparency in the market through the MCDC initiative, the municipal market has responded, although somewhat half-heartedly. As DPC DATA’s study suggests, disclosure timeliness has in fact improved, but primarily in those sectors which are most corporate-like in nature. Hopefully, these findings will be helpful to regulators in determining the effectiveness of compliance measures on a sector-by-sector basis.
Download the report: Municipal Disclosure Timeliness
DPC DATA is the market leader in muni bond information and disclosure data. To know more about how DPC DATA can help you navigate the municipal bond market, please visit www.DPCDATA.com and follow us on Twitter @MuniGUARDNews for the latest news and trends about munis.
Get the latest advances in your inbox!
Sign up and get the latest news and insights about DPC DATA’s municipal bond credit, disclosure, and compliance data solutions delivered right to your inbox.
Categories: Disclosure, Municipal Bond Transparency, MCDC Initiative, Timeliness, Disclosure Timing, Municipal Bond Sectors, Sector Benchmark, CDU, Covenant Disclosure Undertaking, State and Local Government, Bond Issuers

