Resources
Implementing Focused Sector Strategies with DPC DATA’s Sector Mapping
Sector exposure is a key driver of performance for relatively high-quality asset classes such as municipal bonds. DPC DATA’s new Sector Mapping methodology enables more refined sector classifications to reduce portfolio risk or capture more upside from rebounding sectors. This article illustrates how this methodology can be used in two different investment strategies.
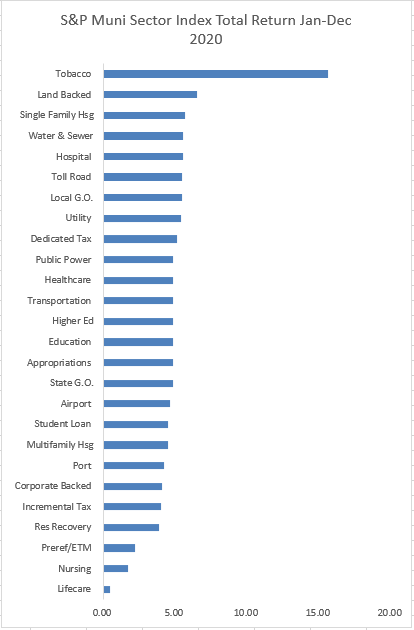
Sector exposure is always a key driver of performance for relatively high-quality asset classes such as municipal bonds. This was particularly true in the extremely volatile year that was 2020. It was a year in which the particular bond you owned didn’t matter as much as the sector you had exposure to, since the pandemic impacted various sectors to drastically different degrees. Compare, for instance, Mass Transit to Utilities, or Housing to Lifecare. This is clearly illustrated by the wide disparity in total return among all the various sectors tracked by the S&P Muni Indices: 1,512 basis points (15.12%) in performance separated the top performer (Tobacco) from the worst performer (Lifecare)!

Source: S&P Muni Index
What if you could further refine your sector strategy through a more granular sector classification that allows you to distinguish between, say, Mass Transit Systems and Toll Roads within the broader Transportation category? Or between Senior Living Facilities and Acute Care Hospitals within Healthcare? Or even between Development Districts, which benefited from the suburban housing boom, and Tax Increment Districts, which probably suffered tax collection declines?
DPC DATA’s new Sector Mapping methodology enables more refined sector classifications. As a result, you can reduce your portfolio risk, or capture more upside from rebounding sectors, as the case may be.
DPC DATA’S Proprietary Sector Mapping
Our Sector Mapping database provides investors with several advantages:
- Consistent and transparent classification methodology, developed based on feedback from major institutional players and in conformity with current industry practices.
- Broad coverage of all active CUSIPs in the marketplace (over 1 million CUSIPs mapped to date).
- Ability to conduct in-depth analysis. The database has over 110 distinct sector/subsector combinations.
- Mapping is done at the individual bond issue level (CUSIP-9).
What’s more, institutional investors who already have an in-house sector mapping scheme for their own holdings can now identify the correct sector for any and all issues available in the secondary market on a pre-trade basis.
Our Sector Mapping correctly identifies the Direct Obligor responsible for debt service. Therefore users can rest assured they are targeting the correct tax-exempt entity and not a mere conduit entity.
Example 1: Implement a Covid-19 Rebound Strategy
Municipal investors who wish to reduce their exposure to sectors that may suffer short-to-medium term damage from the pandemic may want to steer clear of the following sectors and subsectors:

Conversely, the same list may appeal to investors who believe the pandemic has created a buying opportunity in some of these sectors, given the recent passage of the American Rescue Plan Act of 2021.
Conservative market participants may want to stick with sectors and subsectors that have shown resiliency throughout the Covid-19 crisis, such as:

Example 2: Implement a Dedicated Revenue Strategy
Since Detroit’s July 2013 bankruptcy, municipal investors have grown more skeptical of the traditional full faith and credit General Obligation pledge. They have gravitated instead to Dedicated or Securitized Revenue security pledges that are thought to hold up better in Chapter 11. These Dedicated Revenue issues are assigned their own sector in our mapping scheme and are therefore easily identifiable.

Conclusion
Of course, the above examples are for illustration purposes and are not meant as investment advice. Your credit research colleagues may or may not agree with all the items on the list. Their insights should be factored into your strategy. Our sector mapping methodology will enable you to quickly and efficiently define the “sandbox” for any focused strategy you may wish to implement.
To find out how DPC Data’s Sector Mapping system can enhance your investment strategies, contact us at sales@dpcdata.com.
Get the latest advances in your inbox!
Sign up and get the latest news and insights about DPC DATA’s municipal bond credit, disclosure, and compliance data solutions delivered right to your inbox.

